Over the 10 km between Sainte-Foy and Old Québec, at morning rush hour, an e-bike riding at 32 km/h in a tunnel would make the trip in about 28 minutes, door to door, station access included. That's as fast as the car, faster than the bus and the bike on the street, and above all: almost the same time in January as in July.
We ran the numbers for four ways of making this trip that thousands of people take every morning: the car, the bus, the bike outdoors (regular or electric) and the e-bike in a cycling tunnel bored with a Prufrock-type machine, the one built by The Boring Company.
at 32 km/h, access included; 32 min at 25 km/h
parking and walking included
and much longer in winter
walking and waiting included
The route and the assumptions
We compare real “door-to-door” time, not just time in motion.
- Route: 10 km, from Sainte-Foy (Université Laval / Place Sainte-Foy area) to Porte Saint-Jean, along the chemin Sainte-Foy / boulevard René-Lévesque corridor.
- Time: morning rush hour, on a weekday.
- What we count: the trip, plus what people actually go through at each end: finding parking (no reserved spot at work), walking, waiting for the bus, locking the bike, going down to the tunnel.
- Tunnel access: one station 1 km from home and another 500 m from the office. The tunnel covers the remaining 8.5 km. To be safe, we count 12 minutes to get into the tunnel and out of it.
- Speed in the tunnel: 32 km/h, the maximum e-bike assist speed in Québec. We also give the time at 25 km/h.
- Accuracy: these are rounded estimates, built on published data. A real timed field test would be the best follow-up to this article.
- In the tunnel
- On the road (driving, on board or cycling)
- At red lights
- At both ends: parking, walking, waiting for the bus, getting to the tunnel
Door-to-door time for 10 km, morning rush hour, in summer. The beige is the time at both ends of the trip, broken down just below. For the bike tunnel, it includes the kilometre ridden on the street to the station, the 500 m from the station to the office and a safety margin. For the car and the bus, congestion is already included in the time on the road. Rounded estimates based on the sources listed below.
Parking and access: the time at both ends
The clock doesn't start when you sit behind the wheel or on the saddle. You have to leave home, get to your car, your stop or your bike, then, on arrival, park and walk to your destination. That's the beige part of the chart. Here's what it includes for each mode.
| Mode | At departure | On arrival | Total |
|---|---|---|---|
| Car | Walk to the car and pull out of the driveway: ~1 min | Find a street spot or pull into a paid parking lot: ~3 to 5 min. Walk to the destination: ~4 min | ~8–10 min |
| Bus | Walk to the stop: ~5 min. Wait for the bus: ~3 min | Walk from the D'Youville stop to Porte Saint-Jean: ~2 min | ~10 min |
| Bike on the street | Take the bike out: ~1 min | Lock it in front of the door: ~1 min | ~2 min |
| Bike tunnel | Take the bike out: ~1 min. Ride 1 km to the station, with 2 lights: ~3 min. Go down the ramp: ~30 s | Ride up the ramp: ~1 min. Ride 500 m to the office, with 1 light: ~1.5 min. Lock the bike: ~1 min | ~12 min, including ~4 min of margin |
Why does the car lose so much time? A bike parks in front of the door; a car parks wherever there's room left. The bus, for its part, means walking and waiting.
And the tunnel? It's neither at your front door nor at the office door. Getting into the tunnel and out of it takes about 8 minutes, mostly cycling on the street. To be safe, we add almost 4 minutes for station doors and badges, peak crowds and the unexpected. Those 12 minutes are more than the car's; the tunnel wins them back underground, where it never stops. A station on your way costs little: each kilometre ridden on the street rather than in the tunnel adds about a minute. A station that forces a detour costs more: about 3 minutes per kilometre of detour.
In winter, the gap shifts: you often have to clear snow off the car before leaving, and access to the tunnel is via surface bike lanes that need to be properly cleared.
The car: about 30 minutes
According to the TomTom Traffic Index, it takes on average 20 min 16 s to cover 10 km in Québec City at morning rush hour, at an average speed of 29.6 km/h. In the evening, the same 10 km climbs to nearly 24 minutes. Québec City is also in Canada's top 5, with 69 hours lost to congestion in 2025.
But the trip doesn't end behind the wheel. In Old Québec, a car doesn't park in front of the door: you have to find a spot, then walk to your destination. According to a review of studies by urban planner Donald Shoup (UCLA), finding a street spot in a congested downtown takes 3.5 to 14 minutes, 8 minutes on average. Between looking for a spot and walking, count 8 to 10 minutes. A bike, on the other hand, gets locked in front of the door in a minute.
And parking isn't free: $3.50 an hour on the street, about $20 a day in a paid lot.
20 min of driving + 8 to 10 min of parking and walking = 28 to 30 minutes
And that's the average. A snowstorm, an accident on René-Lévesque or roadwork quickly turn an average into a bad surprise.
The bus: 35 to 40 minutes
Since March 2026, tramway construction has changed the RTC network. To get from Sainte-Foy to Old Québec without a transfer, you now take the Métrobus 805. It runs along Grande Allée and stops at Place D'Youville, a stone's throw from Porte Saint-Jean. It comes every 5 to 15 minutes, depending on the time of day.
According to the RTC schedule, the bus takes 25 minutes from the Place-Sainte-Foy stop to the D'Youville stop at midday. At rush hour, count up to 30 minutes (estimate). As with the car, you have to add the time at both ends: walking to the stop, waiting (on average half the time between two buses), then walking to your destination.
~5 min walking + ~3 min waiting + 25 to 30 min on board + ~2 min walking = 35 to 40 minutes
A fare costs $3.85 and a monthly pass, $102.50. In winter, the bus runs in all weather, but it shares the road with cars: on storm days, it slows down too.
Cycling outdoors: 34 to 37 minutes (in summer)
On the street, it isn't the legs that slow cyclists down, it's the stops. A study by ETH Zurich measured an average speed of 19.9 km/h for regular bikes and 21.9 km/h for e-bikes limited to 25 km/h.
Red lights. Along our corridor, count about twenty lights. A red light makes an e-bike wait just as long as a regular bike: the length of the red doesn't depend on the bike. In Zurich, the average wait was 9 seconds per light for regular bikes and 14 seconds for e-bikes, but on different routes. On the same route, we therefore use about 12 seconds per light for both, or 4 minutes for 20 lights. Braking and starting again at every stop adds about a minute in total. The motor gets the e-bike going a bit faster, but the difference is no more than half a minute over the trip.
E-bike: 27 min of riding + ~5 min at lights + ~2 min to take out and lock the bike = ~34 minutes
Regular bike: 30 min of riding + ~5 min at lights + ~2 min to take out and lock the bike = ~37 minutes
A field test published by Caradisiac reaches the same order of magnitude: about 13 seconds of waiting per light, and 14% of travel time spent at lights.
Wind. Sainte-Foy → Old Québec is a west-to-east trip. With prevailing winds often from the west or southwest in the region, the morning ride can come with a tailwind… and the evening ride home, a headwind. A 20 km/h headwind can easily cost a regular bike a third of its speed (estimate).
Winter. In January, the average temperature in Québec City is −11.1 °C, with about 14 days of precipitation in December as in January. Snow, slush, uncleared bike lanes: the trip easily gets 30 to 50% longer (estimate), and most cyclists simply put their bikes away.
The e-bike in the tunnel: about 28 minutes, all year long
The tunnel is neither at your front door nor at the office door. You first ride on the street to the nearest station, then, on the way out, to the office. We assume a station 1 km from home and another 500 m from the office, near Porte Saint-Jean. The project plans a station every kilometre along the tunnels.
Underground, the math is disarmingly simple: no lights, no intersections, no car door swinging open, no wind, no snow. The electric assist holds the speed with no particular effort, and you get to the office without breaking a sweat.
- Home: take the bike out1 min
- Ride 1 km on the street to the station, with 2 lights3.2 min
- Go down the ramp0.5 min
- Ride 8.5 km in the tunnel, at 32 km/h15.9 min
- Ride up the ramp1 min
- Ride 500 m on the street to the office, with 1 light1.6 min
- Office: lock the bike1 min
To be safe, we add 3.7 minutes, bringing access to 12 minutes: station doors and badges, peak crowds, the unexpected. The other modes don't get this margin.
8.3 min of access + 3.7 min of margin + 15.9 min in the tunnel = 27.9 min, or about 28 minutes
At 25 km/h: 8.3 + 3.7 + 20.4 min in the tunnel = 32.4 min, or about 32 minutes
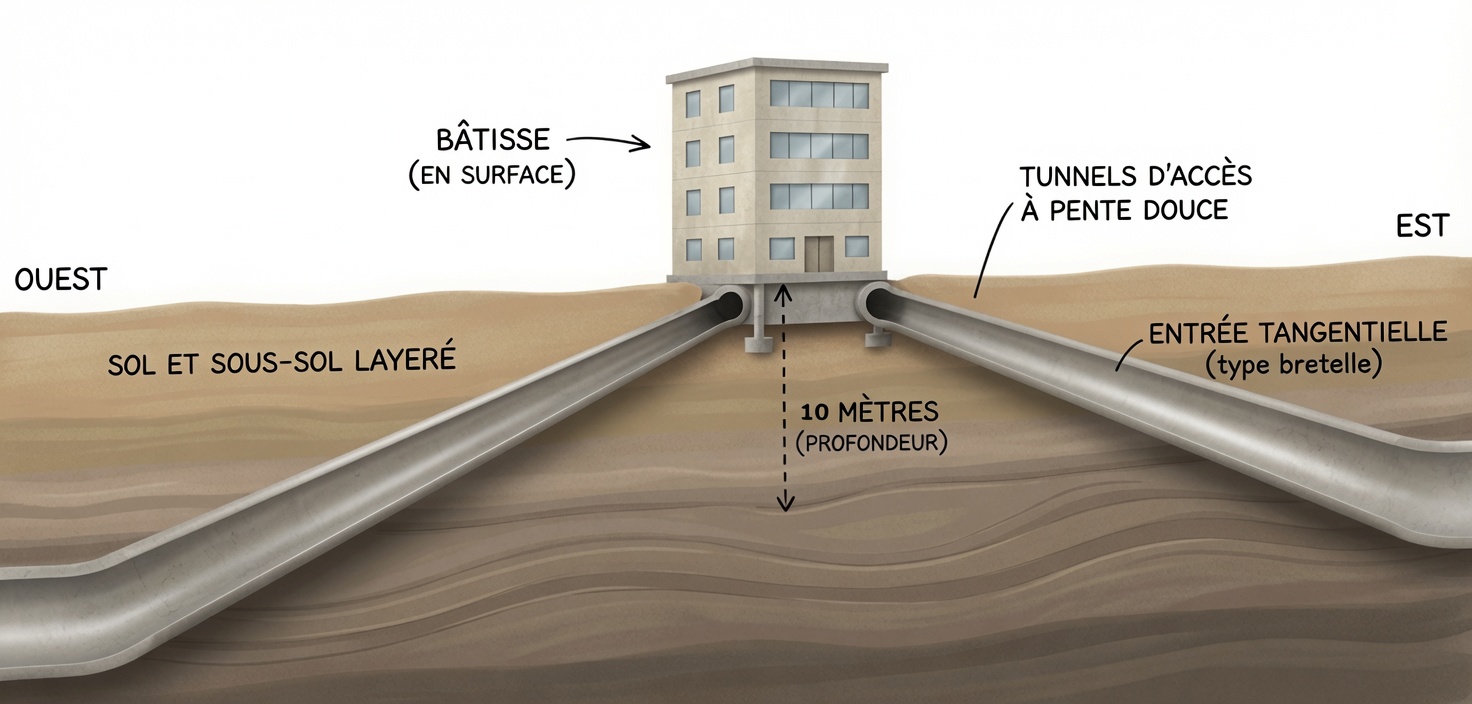
The real difference is consistency. Underground, the temperature stays stable all year round (around 10 °C). Only the surface access, about 1.5 km, is exposed to the weather: in January, the trip takes barely 2 minutes more than in July. And Tuesday's ride takes the same time as Friday's.
Why 32 km/h? In Québec, an e-bike's assist can go up to 32 km/h. In a tunnel reserved for bikes, with no crossings, that speed would be realistic. If the tunnel were limited to 25 km/h, the trip would take about 32 minutes: 2 to 4 minutes more than the car, but still ahead of the bus and the bike on the street.
The comparison
In summer, at 32 km/h, the bike tunnel ties the car and beats the bus and street cycling. At 25 km/h, it trails the car by 2 to 4 minutes. In winter, it's the one the weather slows down the least.
| Mode | Speed used | Trip | Extras | Total (summer) | In winter |
|---|---|---|---|---|---|
| Bike tunnel, 32 km/h | 32 km/h in the tunnel | 8.5 km in 15.9 min | access ~12 min (1 km to the station, 500 m to the office, ramps, margin) | ~28 min | ~30 min |
| Car | 29.6 km/h (TomTom, morning) | ~20 min | parking + walking ~8-10 min | ~28-30 min | longer on storm days, plus the car to clear |
| Bike tunnel, 25 km/h | 25 km/h in the tunnel | 8.5 km in 20.4 min | access ~12 min (1 km to the station, 500 m to the office, ramps, margin) | ~32 min | ~34 min |
| E-bike, street | 21.9 km/h + ~20 lights | ~27 min + ~5 min at lights | ~2 min | ~34 min | +30 to 50%, or bike put away |
| Regular bike, street | 19.9 km/h + ~20 lights | ~30 min + ~5 min at lights | ~2 min | ~37 min | +30 to 50%, or bike put away |
| Bus (Métrobus 805) | RTC schedule | 25–30 min on board | walking + waiting ~10 min | ~35–40 min | slowed on storm days |
What the clock doesn't say
The bike tunnel doesn't just win minutes: it wins reliability.
No traffic jams or storms underground. No need to plan a 15-minute buffer “just in case”.
No snow, ice or rain underground: only the surface access needs clearing.
No cars or trucks in the tunnel. Only the short ride to the station is in traffic.
Versus $3.50 an hour on the street or about $20 a day. Even the subscription under consideration for the tunnel ($30 to $50 a month) costs less than the bus pass ($102.50).
And health: half an hour of moderate physical activity, twice a day, without arriving soaked.
The questions still to settle
A credible project also names its challenges. Here are the ones that will need study:
- Diameter. The Boring Company's machines bore tunnels about 12 feet (3.66 m) in diameter. Is that wide enough for a two-way bike lane, or does each direction need its own tube? (See Dimensions.)
- Cost. The Boring Company is aiming for under US$8M per mile, all-in; with Prufrock 4, it says it has reached US$27M per mile. For 150 km (about 93 miles), that gives an order of magnitude of US$0.75 to 2.5 billion, before access stations, ventilation and lighting. (See Construction costs.)
- Access. Ramps, elevators, bike parking: their number and location determine the real door-to-door time.
- Safety. Ventilation, lighting, emergency exits, cameras, maintenance.
- The ground. The geology of the Québec promontory has to be validated for this type of machine. (See Geology.)
The car's travel time, without the car, twelve months a year.
The bike tunnel doesn't promise to knock out the car. It promises better: the same time, with the safety of a dedicated lane and zero dollars for parking. Now imagine this trip multiplied across a 150 km network linking the region's neighbourhoods.
Do you commute between Sainte-Foy and Old Québec? Tell us how long it takes you, by car or by bike, in our Facebook group.
Sources
- TomTom Traffic Index — Québec City (morning rush hour)
- TomTom Traffic Index — Québec City (2025 overview)
- Narcity — Québec City in Canada's top 5 for congestion (in French)
- Ville de Québec — Copilote+ parking rates (in French)
- Québec Cité — parking near Old Québec (in French)
- blue News / ATS — ETH Zurich study on bike speeds in Zurich (in French)
- Caradisiac — time lost at lights on a bike (in French)
- Climats et voyages — Québec City climate, 1991-2020 (in French)
- Evannex — The Boring Company, diameter and costs
- Basenor — The Boring Company's cost targets
- RTC — network changes due to tramway construction (Métrobus 805)
- Transit — Métrobus 805 schedule (RTC data)
- RTC — fares in effect since July 1, 2026
- Donald Shoup, “Cruising for parking”, Transport Policy, 2006 (via Vivre en Ville)