1. Demand follows infrastructure
The received wisdom holds that cycling is a lifestyle choice, reserved for athletes or mild summers. The data say otherwise: the cycling share rises, sometimes quickly, as soon as a city builds safe lanes and maintains them. In Montréal, the number of bike trips on the island grew by roughly 57 % between 2008 and 2013, and the rapid rollout of the Réseau express vélo (REV) transformed ridership on some corridors in just a few months.
An honest clarification is needed to read these figures correctly. People often quote « 15 % in Montréal »: that is in fact a target the City aims for in its central boroughs within about fifteen years. The current cycling mode share for trips there is more on the order of 3 to 4 %. We will therefore not rely on that Montréal 15 %: the real question is not « do Québec residents want to ride? », but « what stops them today, and does the project solve it? ».
2. The full-scale test: Oulu, Finland
There is a city that answers the question almost perfectly. Oulu, about 200,000 inhabitants, sits 160 km from the Arctic Circle: five months of snow, cold that drops to −25 or even −30 °C — a climate at least as harsh as Québec’s, and colder than our typical winters. Yet cycling there is an ordinary mode of transport, all year round.
| Oulu — indicator | Value | Reading |
|---|---|---|
| Annual mode share (all trips) | ≈ 22 % | More than one trip in five |
| Mode share in deep winter | ≈ 12 % | At −25 °C, facing the wind |
| Summer mode share (inferred) | ≈ 30 % | Implied: the year averages 22 % |
| Residents who ride at least occasionally | ≈ 77 % | From toddlers to seniors |
| Infrastructure | ≈ 950 km | Separated lanes, cleared as a priority |
Oulu achieves these results on the surface, without any tunnel, in a climate harsher than ours. The conclusion of the specialists who have studied the phenomenon is blunt: what keeps people home in winter is not the cold or the snow, but the absence of maintained infrastructure. Asked about their secret, Oulu’s planners answer simply: good lanes and serious winter maintenance.
Two lessons. First, winter cycling in Québec is not a dream: it is a result of engineering and maintenance. Second — and this is crucial to staying realistic — even the best winter cycling city in the world, doing everything right, plateaus around 22 % over the year. Weather is therefore not the only barrier. Any serious target must sit below that ceiling, not beyond it.
3. What the surface already solves — and what it never will
Let’s be honest, because this is what makes the argument credible: two of the classic obstacles in Québec do not require a tunnel.
- Snow on the ground is solved by snow clearing. Oulu proves it every morning: once cleared, compacted snow is not slippery, and two-thirds of cyclists don’t even use studded tires.
- Hills are solved by electric-assist bikes. The Upper Town / Lower Town break stops being an obstacle, and since e-bikes make 18 km trips easy — against 5 to 6 km for Oulu’s typical trip — they clearly widen the pool of potential users.
The tunnel must therefore justify its cost not on what the surface already does, but on what no surface lane can offer, even perfectly built:
- Total separation from cars. The first barrier to recruiting new cyclists — especially women, families and seniors, the « interested but concerned » majority — is neither cold nor hills: it is the fear of traffic. A fully separated network eliminates it absolutely, something a surface lane, even a protected one, never does completely.
- Total shelter from the weather. Snow clearing makes the ground rideable, but does not remove what falls on the cyclist or slows them down: rain, thunderstorms, headwind and the biting cold at −25 °C. A tunnel held at about 10 °C, with no wind or precipitation, removes all of it. This is what converts Oulu’s winter drop (≈ 45 % fewer cyclists in winter) into sustained ridership — and what wins over the cautious commuter, who refuses today to depend on a mode where an unexpected shower can ruin the day. The tunnel offers the weather reliability of a car, 365 days a year.
- Zero black ice. Compacted snow is not slippery; black ice is — and it is a Québec specialty. The tunnel removes it entirely.
To this add a continuous flow, with no stops or red lights, hence predictable travel times. The value of the tunnel is this margin above a maximized surface network, in these precise dimensions.
4. Measuring the target in the right unit
This is where most comparisons go off the rails. Oulu’s 22 % is a share of trips. The project’s target — 100,000 intensive users and 100,000 occasional users — is a share of people (200,000 out of the ~600,000 residents within ~1.5 km (on foot or by bus), i.e. 33 %). The two are not comparable as is. To judge the target honestly, it must be translated into trips.
Let’s lay down this base first, once and for all — everything else depends on it. A « trip » is a journey from point A to point B: going to work is one, coming back is a second. The roughly 600,000 residents near the network each make on the order of 2.5 trips per day — work, studies, school, errands, leisure, visits. Over a year:
600,000 people × 2.5 trips/day × 365 days ≈ 550 million trips per year in the network region, all modes combined (car, bus, walking, cycling).
It is this total — not the number of inhabitants — that serves as the denominator every time this page speaks of « share of trips ». Aiming for 10 % therefore means that on the order of 55 million of those trips would be made through the tunnel rather than by car, bus or on foot. The table below starts from the other end — the users — and lands on the same 10 %.
| Segment | Users | Trips/yr (assumption) | Trips/yr |
|---|---|---|---|
| Intensive users (daily round trip) | 100,000 | ≈ 500 | ≈ 50M |
| Occasional users (leisure, weekends, tourism) | 100,000 | ≈ 75 | ≈ 7.5M |
| Trips on the network | ≈ 57.5M | ||
| Total trips of the catchment (all modes, ≈ 2.5/person/day) | 600,000 | ≈ 915 | ≈ 550M |
| Equivalent mode share (of trips) | ≈ 10 % |
≈ 10 % of trips
Once reduced to the same unit as Oulu, the project’s target corresponds roughly to its winter level (≈ 12 %) — and stays well below its annual average (≈ 22 %). In other words, we are not asking for a feat: we are asking for less than what the coldest city in the world already achieves, on the surface — while the tunnel adds thermal comfort, the absence of black ice and total separation from cars. The target is prudent, not heroic.
5. A route drawn over population density
A mode share only materializes if the trips « fit » within the network. That is why the route was not drawn along the major road arteries, but directly over population density, to maximize the number of trips whose two ends fall near an entrance.
Residents a reasonable distance from the network — on foot, or by bus to an entrance.
People living less than one kilometre from a network route.
Broader catchment, relevant in the e-bike era.
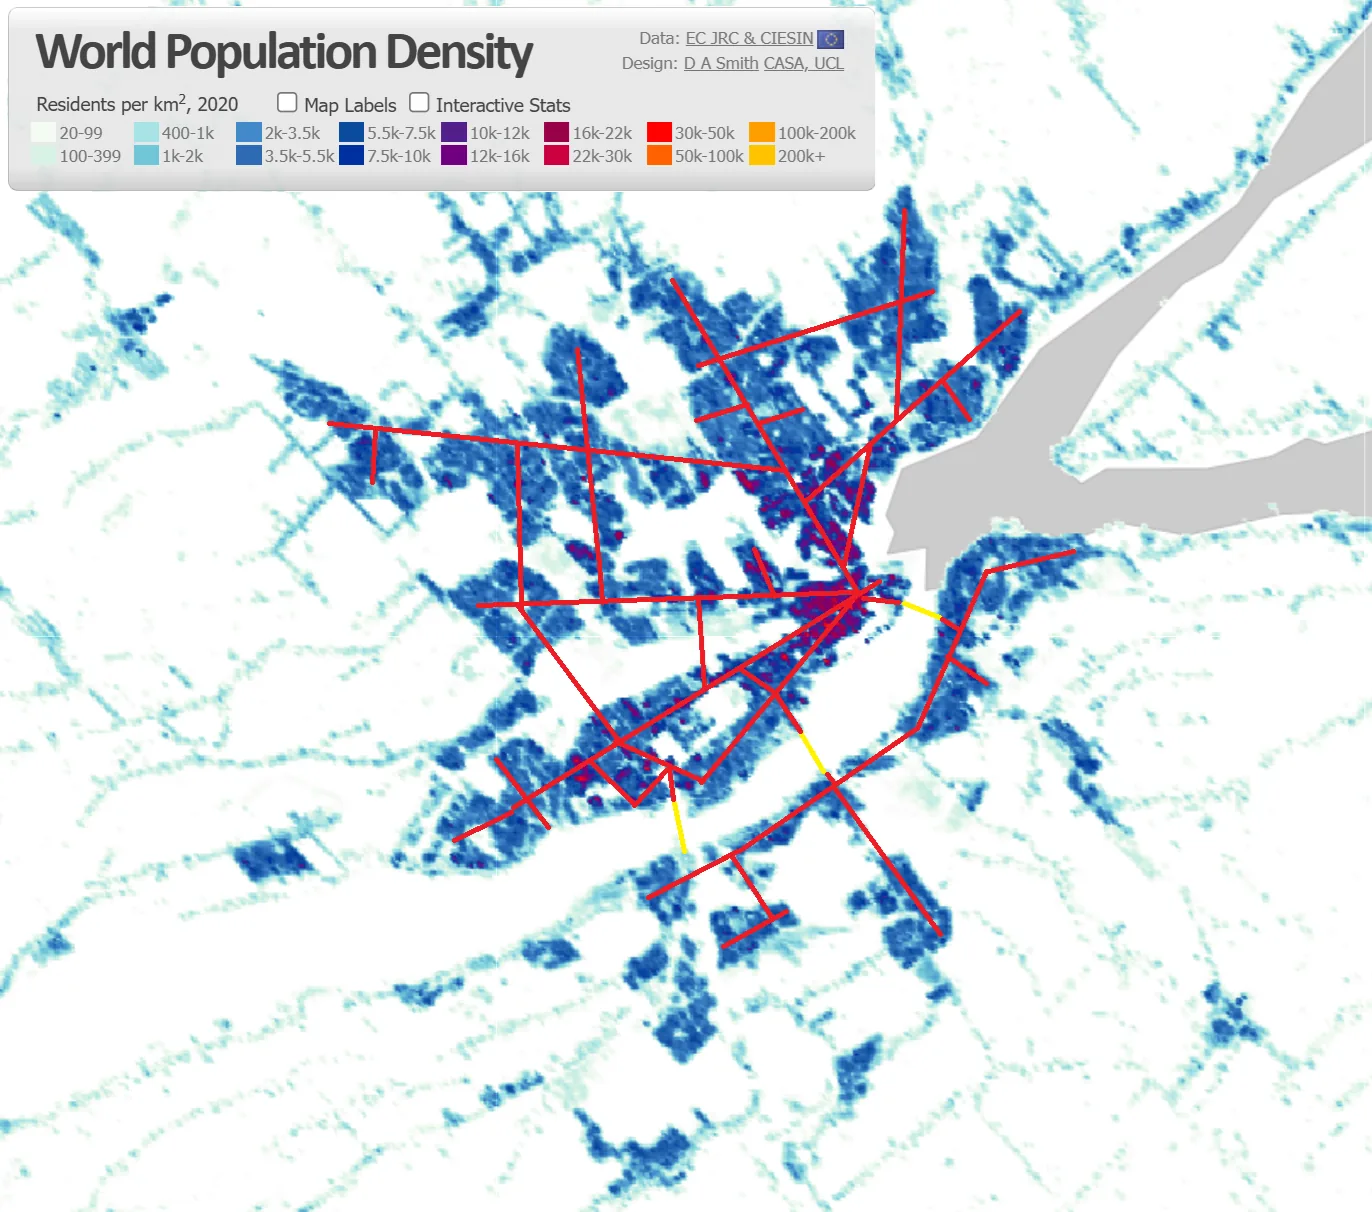
The logic is simple: the denser a corridor, the more people have both their home and their destination near the line. Density is therefore the mechanism that turns « people who would like to ride » into « trips the tunnel actually serves ».
6. The variable that decides everything: origin-destination
Oulu settles the question of willingness: yes, people ride when conditions allow. That leaves a single real unknown, and it is neither cultural nor climatic — it is geometric: how many daily trips in the catchment have both ends near 150 km of network? This does not depend on preferences, but on where people live and travel.
This is also why it is the 100,000 intensive users who matter most: it is their daily trips that carry the amortization of the capital. Occasional users bring revenue and buy-in, but few trips. The entire economics of the project (detailed on the costs page) therefore rests on this origin-destination question — which no argument can settle on paper.
7. A prudent target, validated in stages
Rather than a single figure, here is a range bracketed by the Oulu reference. It honestly situates the target between the winter trough and the annual average of the best winter cycling city in the world.
All the figures rest on a single base: the roughly 600,000 residents near the network together make on the order of 550 million trips per year, all modes combined (car, bus, walking, cycling). The share of trips is the fraction of that total that uses the tunnel; the number of users is the number of people needed to produce it. These are two ways of stating the same target, linked by the number of trips on the network (middle column) — not two quantities to be multiplied by each other.
| Scenario | Share of regional trips | Trips/yr on the network | Users required (intensive + occ.) | Reading relative to Oulu |
|---|---|---|---|---|
| Prudent | ≈ 5 % | ≈ 29M | ≈ 100,000 50,000 intensive + 50,000 occ. | Below Oulu’s winter trough |
| Median (project target) | ≈ 10 % | ≈ 57M | ≈ 200,000 100,000 intensive + 100,000 occ. | ≈ Oulu’s winter level |
| Optimistic | ≈ 18 % | ≈ 101M | ≈ 350,000 175,000 intensive + 175,000 occ. | ≈ Oulu’s annual average |
Why this table cannot be extrapolated to « 100 % = 2 million users »: the percentage applies to trips, not to people, and there are only ~600,000 people near the network. Even if every one of them became a cyclist, the ceiling would land around 30 % of trips — Oulu’s summer level — because a large share of trips (long distances, hauling loads, destinations off the network) cannot be made by bike. The table therefore only makes sense within its realistic range of 5 to 18 %. The 50/50 intensive/occasional split is illustrative, and « 200,000 users » does not mean 200,000 daily commuters: half ride only a little.
Above all, the project asks no one to bet $12.7B on a forecast. It proposes to measure first. Phase 1 — a central 15 km segment linking Sainte-Foy, Université Laval and Old Québec, for about $1.2B — serves precisely as a test: there we observe the real mode share of the corridor once the network is in service.
The only reliable judge. If Phase 1 approaches the 10–12 % of trips the model assumes, demand is no longer a hypothesis to defend: it is measured data, sufficient to justify the rest of the network. If it stays below the bar, we will have learned it for $1.2B rather than for $9.5B. That is how a major project is de-risked.
8. Conclusion
Demand for an underground cycling network in Québec is credible, and one can say so without exaggeration. The cycling share responds to infrastructure (Montréal, and above all Oulu, which rides at −25 °C on the surface). Winter and hills are already solvable — through snow clearing and e-bikes — which refocuses the tunnel’s value on its truly exclusive advantages: the total separation from cars, which tackles the real barrier of fear of traffic; complete shelter from rain, wind, storms and cold, 365 days a year; and the elimination of black ice. Measured in the right unit, the target equals Oulu’s winter level, below its annual average: prudent, not heroic. The only variable that decides everything — the geometry of trips — is not settled by argument, but by Phase 1. Build 15 km, measure, then decide.
Download the full market study (PDF)
Main sources. Oulu (Finland), a city where people cycle year-round, even in the snow: Euronews (about one trip in five by bike, 12 % in winter), peer-reviewed study, PLOS One (2025) on the potential of cycling in cold climates, and BicycleDutch (18 % of trips by bike in the Oulu region, 22 % downtown, more than 40 % of school trips).