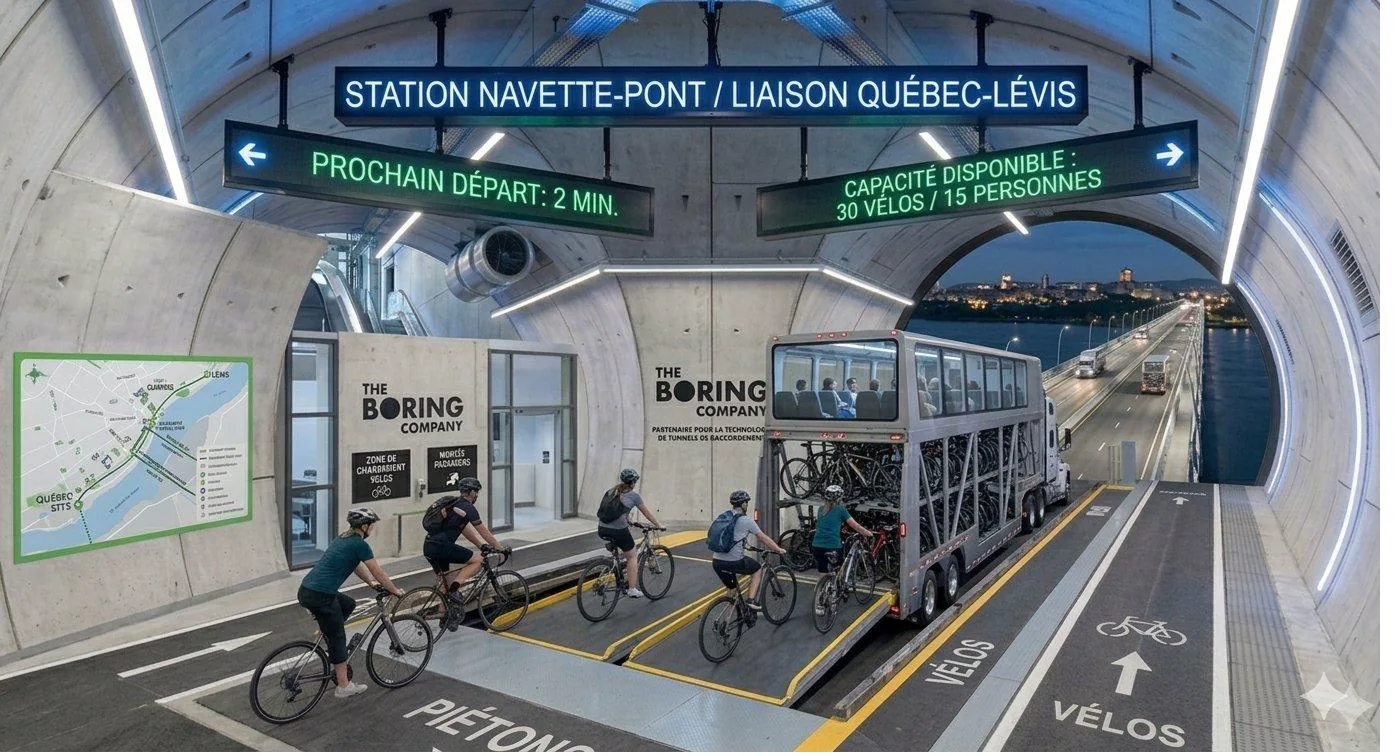
Shuttle-truck
24-hour service: a departure every 2 minutes at peak, every 5 minutes during the day and every 15 minutes at night. Each truck carries up to 50 bikes and 55 people (the 50 cyclists and 5 walk-on passengers). Real-time display of the next departure and available capacity.
An economical transition solution before the construction of a dedicated under-river tunnel.
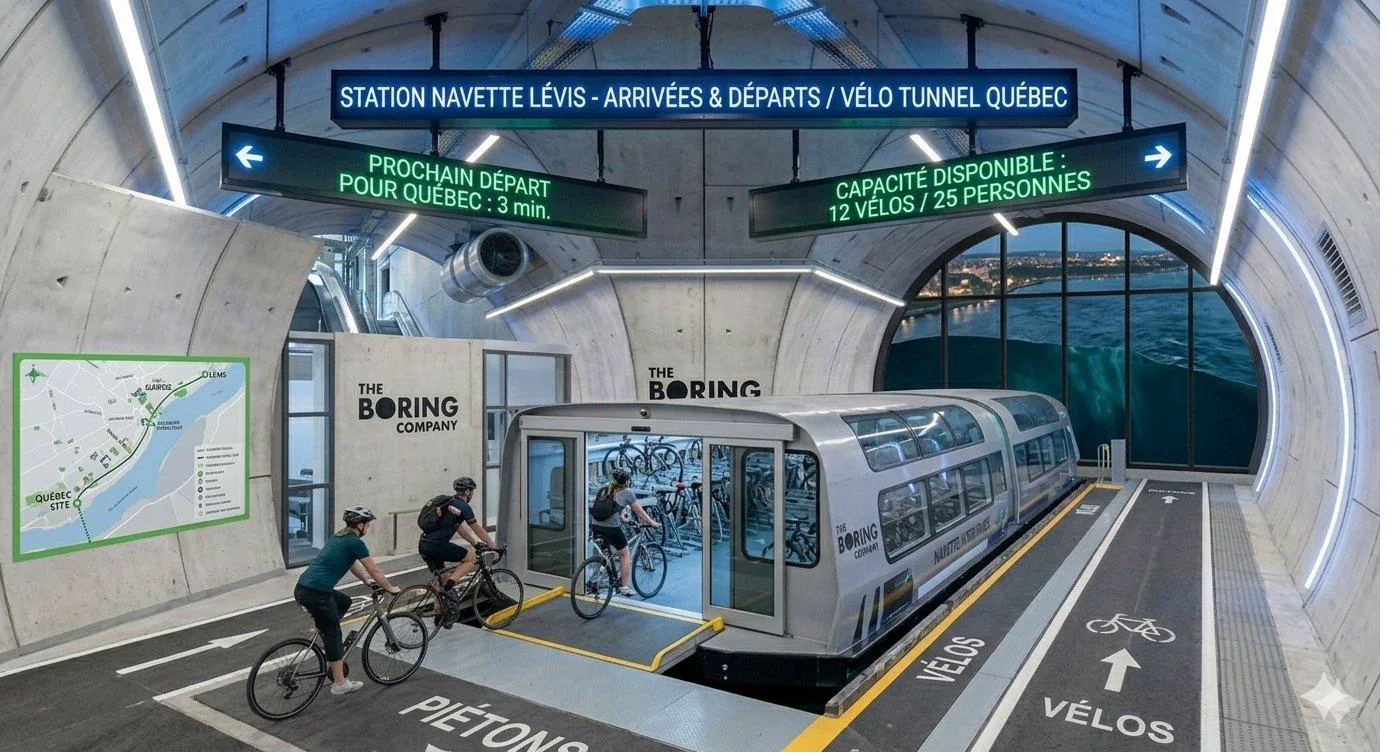
Shuttle-boat
A shuttle-boat adapted for carrying bikes rounds out the offering, especially in summer. Large capacity — up to 60 bikes and 100 people per trip (the 60 cyclists and 40 walk-on passengers) — and a scenic crossing of the St. Lawrence River.
The Lévis station continuously displays the next departures toward Québec, with the round trip running non-stop.
How many people will cross the river?
The cycling crossing demand is a fraction of a flow that already exists. Today, on the order of 200,000 people cross the river each day (both directions, all modes), a core of 45,000 to 50,000 regular commuters. But crossing remains the exception: fewer than 4% of North Shore trips cross the river, and about three quarters of Lévis motorists never cross the bridges.
Vehicles per day, both directions (Pierre-Laporte + Québec Bridge).
Bikes carried per year, mostly in summer — a baseline to build on.
Of the 100,000 intensive users whose trip crosses the river.
Applying a conservative capture (crossing forces a transfer the rest of the network does not), we get three scenarios of cycling demand.
| Scenario | Share captured | Crossings/day (one way) | AM peak (bikes/h) |
|---|---|---|---|
| Conservative | ≈ 5% | ≈ 5,000 | ≈ 700–1,000 |
| Median (target) | ≈ 10% | ≈ 10,000 | ≈ 1,500–2,000 |
| Optimistic | ≈ 15% | ≈ 15,000 | ≈ 2,200–2,800 |
Three modes sized to maximize throughput
A bike always crosses with a person: capacities are expressed as “bikes + total people,” the people count including the cyclists. The vehicles are re-sized to maximize throughput, and winter structures everything — ice runs in the river from December to March, when the boat stops and the shuttle-truck carries it all.
| Mode | Capacity / departure | Breakdown | Role |
|---|---|---|---|
| Shuttle-truck | 50 bikes / 55 people | 50 cyclists + 5 walk-ons | Year-round backbone |
| Shuttle-boat | 60 bikes / 100 people | 60 cyclists + 40 walk-ons | Summer complement |
| Ferry (STQ) | Several dozen | existing, free with a pass | Baseline, leisure |
Frequency, throughput and fleet
“Every 5 minutes” is not a ceiling: the tighter the headway, the higher the throughput. With 50 bikes per truck, a 2-minute headway (conservative scenario) already delivers 1,500 bikes/hour per direction.
| Truck headway (peak) | Departures/h | Throughput (bikes/h, per direction) | Active trucks |
|---|---|---|---|
| every 5 min | 12 | 600 | ≈ 7 |
| every 2 min (conservative) | 30 | 1,500 | ≈ 18 |
| every 1.5 min (median) | 40 | 2,000 | ≈ 23 |
| every minute (optimistic) | 60 | 3,000 | ≈ 35 |
In summer the boat adds ≈ 240–360 bikes/h. Recommended fleet: ≈ 26 shuttle-trucks (≈ 23 active at median peak + spares) and 4 shuttle-boats. At launch fewer run (≈ 18 trucks every 2 min), then the headway tightens as demand grows.
The threshold that triggers the tunnel
With these vehicles, the shuttle now comfortably covers both the conservative AND median scenarios. Only in the optimistic scenario (2,200–2,800 bikes/h) does the link saturate, when even a 1-minute headway means ≈ 35 trucks bumper-to-bumper on the bridge — and that breaking point is precisely what justifies building the dedicated under-river tunnel. The shuttle does not endure mature peak demand: it measures it, and its saturation triggers the tunnel.
What does it cost?
Larger, more numerous vehicles raise the rolling stock, but it is only ~30% of the total — it is still the terminals that dominate.
| Purchase (capital) | Quantity | Unit price | Subtotal |
|---|---|---|---|
| Shuttle-truck (purpose-built articulated, 50 bikes/55 people) | 26 | ≈ $500,000 | ≈ $13M |
| Shuttle-boat (aluminum catamaran, 60 bikes/100 people) | 4 | ≈ $4M | ≈ $16M |
| Rolling stock — total | ≈ $28–30M | ||
| Terminals (Lévis + Québec) | 2 | — | ≈ $60M |
| Link total | ≈ $90M |
| Operation (annual) | Detail | Cost/year |
|---|---|---|
| Salaries (≈ 90 FTE) | drivers + boat crews + ground staff | ≈ $7M |
| Fuel + maintenance + terminals | 24/7 diesel, parts, dock operation | ≈ $8M |
| Total — shuttles | ≈ $15M/year |
That is ≈ $28–30M to buy and ≈ $15M/year to run — about 8% of the $194M/year operating cost of the whole network. For ≈ $5M more in capital and ≈ $5M more per year than the original version, peak throughput is multiplied by 4 to 8. An excellent trade-off.
Download the detailed analysis (PDF) →
Main sources. This page draws on our detailed analysis: download the shuttles analysis (PDF).